
The current Okanagan Similkameen Homes search contains 1,211 publicly displayable DDF® records across eight communities. Houses account for 590 records, while apartments and row or townhouses together account for 386—31.9% of the current search.1
That mix matters because a regional listing total can make buyer choice look broader than it feels. A household looking for a Penticton apartment, an Osoyoos townhome, a Princeton house or a Keremeos manufactured home is not shopping the same pool. Property form, ownership, monthly costs, financing and due diligence can change the practical shortlist before price is even considered.
The 1,211-record total is 43 lower than the 1,254 records captured on September 28, a net change of 3.4%.12 That does not mean 43 homes sold. New listings, completed sales, expirations, withdrawals, relists, status changes and feed boundaries can all change the ending count. The useful Monday question is not, “Did 43 sell?” It is, “What can a buyer actually choose from now, and how does that choice change by property type and community?”
Current choice is broad in total, but property form and ownership quickly narrow the useful shortlist.
CURRENT INVENTORY
The current total is lower, but it is not a weekly sales report
Last Monday’s snapshot contained 1,254 records. This Monday’s contains 1,211.12 The arithmetic difference is 43 records, but the cause cannot be determined from the two ending totals alone.
Imagine that 73 records left the feed while 30 entered. The total would fall by 43. It would also fall by 43 if 48 left and five entered. Those scenarios could include sales, expirations, cancellations, duplicate cleanup, relists or changes in display eligibility. The net movement is real; the transaction story behind it is not available from the snapshot.
That distinction protects buyers and sellers from a tempting but unsupported conclusion. A lower current count does not prove that demand suddenly accelerated, that prices rose, or that every segment tightened. It also does not prove that owners broadly stopped listing. To make those claims responsibly, we would need complete activity records with consistent dates, statuses, geography and property definitions.
What the current feed can answer is narrower and still useful: at 12:04 p.m. on October 5, it displayed 1,211 records across Penticton, Osoyoos, Oliver, Summerland, Princeton, Keremeos, Okanagan Falls and Hedley.1 Buyers can use that live pool to understand current alternatives. Sellers can use it to identify visible competition. Neither should treat it as a completed-sales ledger.
PROPERTY MIX
Houses are the largest category, not the whole market
The current structure mix is:1
| Structure in the current DDF® snapshot | Records | Share of current search |
|---|---|---|
| House | 590 | 48.7% |
| Apartment | 255 | 21.1% |
| Row / townhouse | 131 | 10.8% |
| Manufactured or park-model home | 89 | 7.3% |
| Duplex, triplex, fourplex or multifamily | 70 | 5.8% |
| Other | 76 | 6.3% |
| Total | 1,211 | 100.0% |
A house is the largest single category, but it is less than half of the current search. Apartments and row or townhouses combine for nearly one third. Manufactured and park-model homes add another 89 records. That means a broad “homes for sale” headline blends property forms with materially different documents, costs and buyer pools.
The categories also describe structure, not quality, value or suitability. A house may be urban, rural, freehold, leasehold, newly built or in need of substantial work. An apartment may have low or high strata fees, strong or weak contingency funding, rental restrictions, age-related rules where lawful, parking limitations or planned capital work. A manufactured home may sit on owned or leased land. A townhome may be freehold or strata.
For buyers, the first filter should therefore be acceptable property forms—not merely a maximum price. For sellers, the competitive set should be the few homes a likely buyer would compare directly, not every one of the 1,211 records.
OWNERSHIP AND COST
Structure and ownership answer different questions
The ownership field in the same snapshot identifies 696 freehold records, 352 condo or strata records and 113 leasehold records. The field was unpopulated on 50 records.1
Those figures should not be added to the structure categories as though they were separate homes. They are a second lens on many of the same records. “Apartment” describes a structure; “condo/strata” describes an ownership framework. “Manufactured home” describes a form of housing; the land arrangement may still be freehold or leasehold. “House” does not automatically mean fee-simple ownership.
A buyer comparing ownership types should examine the complete carrying cost and the legal interest being purchased. For a strata property, that can include monthly fees, insurance, bylaws, minutes, depreciation reporting, contingency funding and potential special levies. For leasehold, the lease term, payment structure, assignment provisions, financing availability and expiry or renewal terms can materially affect the decision. For freehold, maintenance, utilities, servicing, access, water, septic or acreage considerations may move directly to the owner where applicable.
Financing can also differ. A lender applies its own property, appraisal, qualification and product criteria. A lower asking price does not guarantee that a particular ownership or property form fits the buyer’s financing. Confirm the structure and title early enough that the lender, insurer, lawyer or notary and other relevant professionals can review the actual property.
LOCAL LENS
Penticton and Osoyoos offer different mixes
Penticton has 403 records in the October 5 snapshot: 176 houses, 102 apartments, 59 row or townhouses, 15 manufactured or park-model homes and 40 duplex, triplex, fourplex or multifamily records, plus 11 records in other categories.1
Osoyoos has 299 records: 115 houses, 115 apartments, 39 row or townhouses, 12 manufactured or park-model homes, five duplex, triplex, fourplex or multifamily records and 13 other records.1 Apartments and houses have equal counts in the Osoyoos mix, unlike in Penticton. That does not make either community better or easier; it shows why a regional property-type percentage can hide local differences.
The smaller-community mix is different again. Princeton’s 73 records include 43 houses and 19 manufactured or park-model homes, while Keremeos has 67 records including 32 houses and 21 manufactured or park-model homes.1 Oliver’s 161 records are more house-heavy, with 101 houses. Summerland has 148 records, including 86 houses, 21 apartments and 13 row or townhouses. Okanagan Falls has 56 records, and Hedley has four.1
Small counts deserve special care. One listing entering or leaving a four-record market changes the apparent percentage dramatically. A buyer may also have non-negotiable needs involving medical access, schools, commute, winter travel, transit, services, utilities, internet, lot use or family support. A broader property category in another community is not useful if the location cannot support daily life.
The practical sequence is lifestyle and location first, acceptable property form and ownership second, then budget, condition and property-specific evidence. Reversing that sequence can create a long search that contains many records but very few realistic options.
LATEST COMPLETE DATA
August remains the latest complete sales baseline
The latest complete Association report remains August 2026. Across all South Okanagan property types, it recorded 129 sales, 277 new listings and 1,880 active listings at month-end.3 Its stated scope includes residential, farms, multifamily, land and commercial property, so it must remain separate from the October 5 consumer-search snapshot.
The Association’s selected residential categories reported 55 August sales and 531 listings for single-family homes excluding lakefront and acreages; 20 sales and 290 listings for apartments; and eight sales and 137 listings for townhomes.3 The report also showed average days to sell of 97 for that single-family category, 80 for apartments and 33 for townhomes.3
Those figures do not mean every townhome was quicker to sell than every apartment or house. The townhouse sample contained only eight sales, and category composition can strongly affect a one-month result. Location, condition, age, price, ownership, fees, presentation and motivation still matter. A property-specific analysis should use the closest relevant completed sales rather than assigning the regional category average to one home.
The current DDF® mix and the August report answer different questions. The live snapshot shows what visitors can browse now in eight approved communities. The monthly report shows completed August activity and month-end inventory under the Association’s definitions. Dividing one dataset by the other would create a misleading hybrid measure.
FOR BUYERS, SELLERS AND OWNERS
What this means for you
ACTION PLAN
A practical plan for this week
- Choose the property forms that work. Decide whether houses, apartments, townhomes, manufactured homes or small multifamily properties fit the household and financing plan.
- Confirm ownership early. Do not infer freehold, strata or leasehold from the building’s appearance. Read the listing details and verify title, lease or strata information.
- Build the complete monthly cost. Include mortgage payment, property tax, insurance, utilities, strata or lease charges and a realistic maintenance allowance.
- Narrow by community and daily life. Test travel, services, support networks and seasonal access before assuming a larger regional pool creates meaningful choice.
- Compare like with like. Use current listings to understand today’s alternatives and relevant completed sales to study value. Keep property type, ownership and micro-market aligned wherever possible.
- Review the documents that match the property. Strata records, leases, inspection results, water or septic information, permits, zoning, insurance and title issues are not interchangeable checklists.
- Refresh before acting. DDF® inventory changes as records are added, revised or removed. Recheck availability and property facts before writing an offer or changing a listing strategy.
RICO’S VIEW
Rico’s view: count the homes that fit, not every home
A 1,211-record regional search sounds large. For a buyer, the useful market may shrink to 20 homes after community, structure, ownership, budget and essential features are applied. For a seller, the direct competitive set may be five nearby properties rather than every house, apartment and acreage in the region.
This week’s snapshot supports a calm conclusion. The displayed total is 43 records lower than last Monday, but that net change is not a weekly sales count. Houses remain the largest category, yet more than half of the current records are another structure type. Penticton, Osoyoos and the smaller communities also carry different mixes.12
The best next step is not to label the whole region as tight or slow. It is to define the property decision precisely, compare the right current alternatives and then bring in the relevant completed evidence.
Use the guided Matchmaker to organize community, property type, ownership, budget and timing. If you are planning a sale, visit Sell, or contact Rico for a property-specific comparison.
This article provides general real-estate information, not a valuation, forecast, mortgage, insurance, legal, tax, appraisal or investment recommendation. Listing availability and classifications can change. Confirm current property facts, financing and professional-advice requirements for your circumstances.
Sources
- Okanagan Similkameen Homes — current DDF® inventory snapshot, captured October 5, 2026 at 12:04 p.m. PDT
- Okanagan Similkameen Homes — September 28 listing price-band snapshot
- Association of Interior REALTORS® — South Okanagan Monthly Statistics, August 2026
- Wikimedia Commons — Osoyoos Downtown photograph by GoToVan
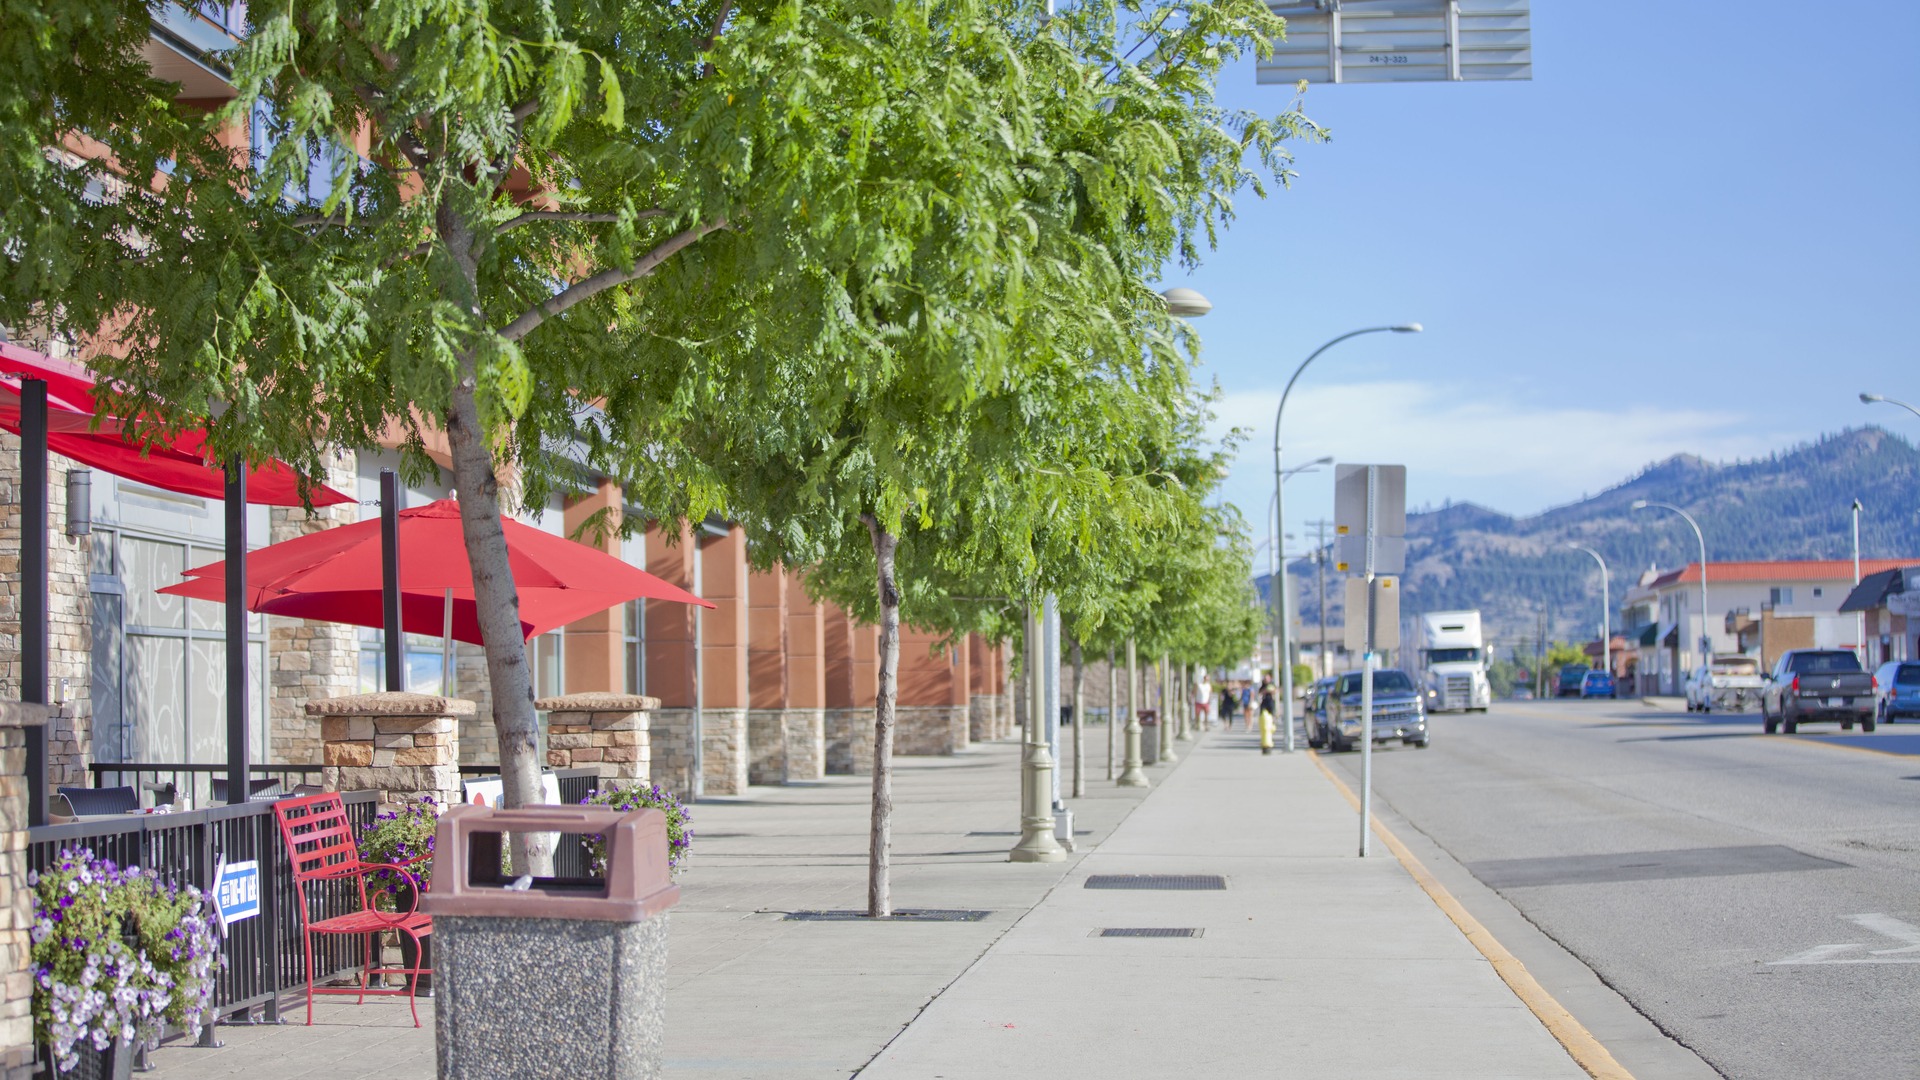
Image credit: GoToVan, Wikimedia Commons, CC BY 2.0. Representative downtown Osoyoos streetscape; not a listing or depiction of October 2026 inventory or market conditions. Cropped from the original and resized to 1,920 × 1,080; no synthetic elements added.
Turn the information into your next step
Choose the path that matches the decision you are making now.
Planning a Penticton move? Explore Rico’s Penticton real estate guidance and current listings.