
South Okanagan real-estate activity slowed in August. The Association of Interior REALTORS® monthly report—not the website’s DDF® feed—recorded 129 sales across all property types, down 29.5% from August 2025. It also reported 1,880 active listings at month-end, down 9.4% year over year, and 277 new listings during the month, down 22.4%.[1][2]
The numbers point to a quieter month, but not to one simple conclusion about every home or community. The Association connected some of the broader Interior slowdown to wildfire disruption and emphasized that affected communities were focused on safety and displacement. Its release did not quantify how much of the South Okanagan’s 29.5% sales decline was caused by wildfires, so the fires are important context rather than a complete explanation. At the same time, South Okanagan townhome and condominium benchmark prices were higher than in August 2025.[1]
August recorded 129 total sales, 1,880 month-end active listings and 277 new listings. Compared with August 2025, those figures were down 29.5%, 9.4% and 22.4%, respectively.[2]
THE NUMBERS
The August market in three measures
The Association’s South Okanagan monthly report covers residential property, farms, multifamily, land and commercial property. On that broad basis, August produced 129 sales, compared with 183 in both July 2026 and August 2025. Total dollar volume was $99.8 million, down 9.0% from one year earlier. The 1,880 active listings at month-end were below July’s 1,923 and August 2025’s 2,074.[2]
Those topline figures combine unlike property categories. A vineyard acreage, downtown apartment, building lot and neighbourhood single-family home do not compete for the same buyer. The residential-only table is therefore a useful second lens: it recorded 116 sales in August, down 33.7% year over year, with 1,328 residential listings in inventory, down 12.9%.[2]
| August 2026 segment | Sales | Year-over-year change | Inventory |
|---|---|---|---|
| All property types | 129 | −29.5% | 1,880 |
| Residential total | 116 | −33.7% | 1,328 |
| Single-family* | 55 | −39.6% | 531 |
| Apartment | 20 | −42.9% | 290 |
| Townhome | 8 | −57.9% | 137 |
*Single-family excludes lakefront and acreages in the Association report.
Manufactured-home sales were an exception to the general decline, rising to 17 from 14 one year earlier. Small categories can move sharply in percentage terms when only a few transactions are involved. Eight townhome sales, for example, are not enough to support a sweeping conclusion about every strata development from Summerland to Osoyoos.[2]
SUPPLY & PACE
Less activity did not mean more month-end supply
A slower sales month can sound as though buyers must have had more choice. August’s inventory numbers show why that assumption needs care. Total South Okanagan inventory was 9.4% lower than a year earlier, while residential inventory was 12.9% lower. New residential listings were also down 24.3%, with 221 coming to market compared with 292 in August 2025.[2] That reduced flow of new supply helps explain why buyer choice could tighten even while sales slowed. Inventory also reflects sales, expirations, withdrawals and other listing changes, so the monthly table does not support attributing the entire decline to owners choosing not to list or relist.
The direction varied by property type. Single-family inventory, excluding lakefront and acreage, declined 16.3% year over year to 531. Apartment inventory declined 11.3% to 290. Townhome inventory moved the other way, rising 3.0% to 137 despite fewer new townhome listings and fewer August sales.[2]
The report’s sales-to-inventory ratio was 10.36% for single-family homes, 6.90% for apartments and 5.84% for townhomes. These measures describe August’s recorded sales relative to reported inventory; they are not a guarantee of how quickly a particular property will sell.[2]
Marketing time also lengthened in the broad statistics. All-property days to sell averaged 99 in August, up from 90 one year earlier. The residential-only average was 92 days, compared with 90. Single-family homes averaged 97 days, apartments 80 days and townhomes 33 days, but the townhome figure came from only eight transactions.[2]
PRICE SIGNALS
Mixed measures require a careful reading
The Association’s regional release reported a South Okanagan townhome benchmark price of $504,700 in August, 2.7% above August 2025. The condominium benchmark was $435,900, up 1.1% year over year.[1]
Benchmark prices are designed to track a representative home over time and are generally more useful for trend reading than a single month’s average. The monthly tables nevertheless provide transaction context: a $640,000 median for single-family homes excluding lakefront and acreages, down 4.5% year over year; a $380,000 apartment median, up 12.8%; and a $612,000 townhome median, up 27.5%.[2]
The large townhome median change should not be read as proof that every townhome gained 27.5%. Only eight townhomes sold in August, and the size, age, location and quality mix of those sales can shift a median. The more restrained 2.7% benchmark increase tells a different and more stable story for the representative townhome.[1][2]
Through August, South Okanagan residential sales totalled 1,183, down 4.5% from the same period of 2025. The year-to-date residential median was $580,000, down 1.7%, while average days to sell rose to 87 from 84.[2]
Taken together, the data do not support a blanket statement that prices are rising or falling everywhere. Lower supply did not automatically push every measure upward: detached-home and year-to-date residential medians were lower, while apartment and townhome measures were higher. The more useful conclusion is that sales activity was weaker, inventory was also lower than a year ago, and the price effect depended on the property type, sample size and measure used.
CURRENT INVENTORY
The DDF® feed is a separate, fresher snapshot
The monthly report’s 1,880 active-listing figure is a month-end statistical total across all South Okanagan property types. Rico’s owned-site DDF® export is a different dataset: it is a current consumer-search snapshot restricted to eight approved communities and publicly eligible records from the authorized feed.[2][4]
At 8:17 a.m. PDT on September 7, 2026, that DDF® snapshot contained 1,250 current listings: 398 in Penticton, 333 in Osoyoos, 164 in Oliver, 150 in Summerland, 74 in Princeton, 69 in Keremeos, 57 in Okanagan Falls and five in Hedley.[4]
The two inventory counts should not be subtracted to claim that 630 listings disappeared. The Association number was generated from its system at midnight on September 1 and includes categories and geography defined in the monthly report. The DDF® number was refreshed six days later, applies the website’s eight-community whitelist and public-display eligibility rules, and can change as listings are added, updated or removed.[2][4]
For a person planning a move this week, the live DDF® inventory is the better starting point for seeing what is currently available on the owned site. For interpreting August market performance and year-over-year trends, the Association’s closed monthly dataset is the appropriate source.
LOCAL LENS
Community context matters
Penticton and Osoyoos together accounted for 731 of the 1,250 listings in the September 7 owned-site snapshot. That concentration does not mean those markets behave alike. Penticton includes detached neighbourhoods, apartments, townhomes, manufactured-home communities and lake-adjacent property. Osoyoos has its own mix of resort-oriented strata, lake influence, retirement demand and detached housing. Each segment should be reviewed separately.[4]
The Similkameen communities in the site’s feed—Princeton, Keremeos and Hedley—had 148 listings combined in the same snapshot. Smaller inventory pools can produce fewer close comparables and more variation between properties. Buyers should pay particular attention to servicing, water, septic, zoning, insurance, access, outbuildings and rural-property due diligence where applicable.
Wildfire conditions are part of the August context, not a slogan for predicting the fall. The Association said wildfire activity dampened demand across the Interior during August and acknowledged evacuations, displacement and home loss.[1] Anyone buying or selling in an affected or higher-risk area should verify current access, insurance availability and property-specific conditions rather than treating a regional market release as an insurance or hazard assessment.
ACTION PLAN
A practical plan for this week
- Define the segment before reading the trend
Separate detached homes, apartments, townhomes, manufactured homes, acreages and land. A blended regional number cannot replace a category-specific comparison.
- Use current competition and completed sales for different jobs
Active listings show what buyers can choose today. Completed sales help establish what the market recently accepted. Review both.
- Check the age and source of every number
August sales and month-end inventory are lagged monthly statistics. The DDF® search inventory is current to its displayed refresh time and may change during the week.
- Build in due-diligence time
Financing, insurance, inspection, title review, strata documents, tenancy records and rural servicing can matter more than a broad market percentage.
- Reassess after the next complete release
One disrupted month should not be stretched into a firm forecast. Watch whether sales, new listings, inventory and category benchmarks confirm or reverse the August pattern.
RICO’S VIEW
Make the decision property-specific
August rewards a calm, property-specific approach. Buyers may find more negotiating room on homes that have been exposed to the market for a while, but lower year-over-year inventory means waiting for a perfect option can also narrow the field. Sellers should not read lower inventory as permission to overprice; the lower sales counts and longer marketing times show that buyers were selective.
The useful conversation is not “Is the whole market up or down?” It is “What is happening for this type of home, in this community, at this price, with these documents and this competition?” That is where broad market information becomes a practical plan.
This article provides general real-estate information, not a valuation, forecast, mortgage, insurance, legal, tax or investment recommendation. Statistics may be revised. Confirm current listing status, property facts, financing, insurance and professional-advice requirements for your circumstances.
Sources
- Association of Interior REALTORS® — August 2026 market release
- Association of Interior REALTORS® — South Okanagan Monthly Statistics, August 2026
- Wikimedia Commons — Osoyoos BC 2008 photograph
- Okanagan Similkameen Homes — current DDF® inventory

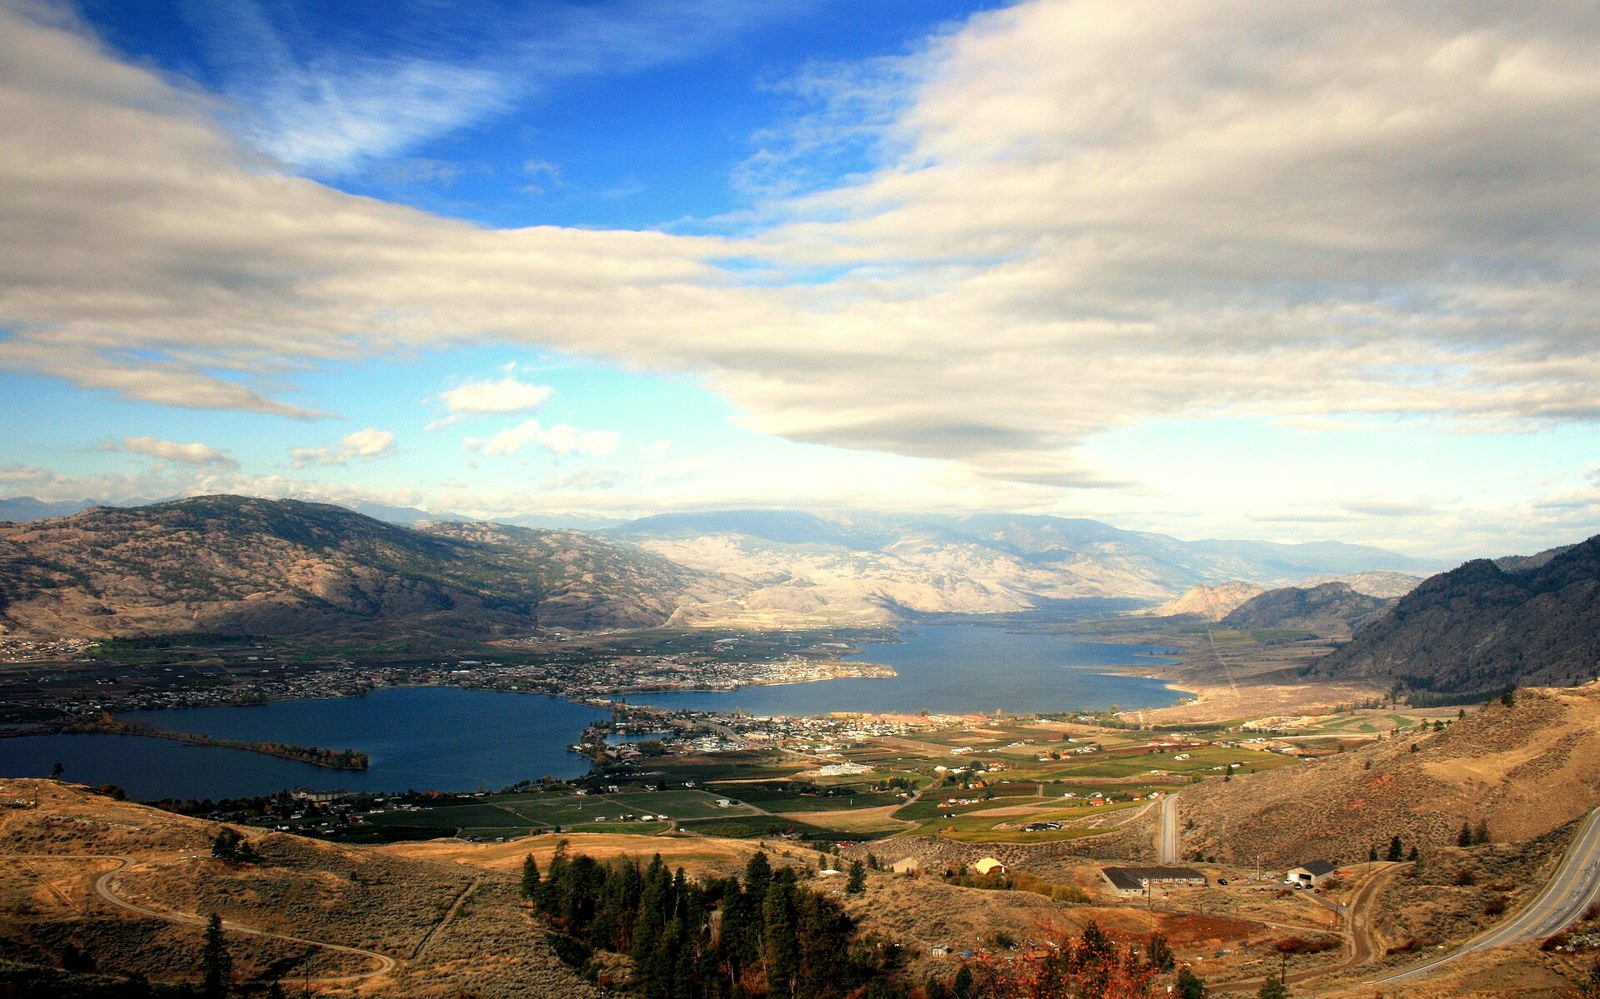
Image credit: David Wise, Wikimedia Commons, CC BY 2.0. Representative elevated view of Osoyoos and Osoyoos Lake; it is not a current listing or a depiction of August 2026 market conditions.
Turn the information into your next step
Choose the path that matches the decision you are making now.
Planning a Penticton move? Explore Rico’s Penticton real estate guidance and current listings.