
This week’s South Okanagan numbers point to a market where buyers can take a breath—but not switch off—and sellers need to listen closely to the first response from the market. New activity eased from the previous week, every residential price change was a reduction, and most residential sales reported during the period were below $800,000.
For buyers, that means choice and negotiation may be available, especially when a listing has already tested the market. For sellers, it means the opening price, presentation and response to early feedback matter more than waiting for the market to rescue a weak position.
Seven-day Xposure Hotsheet snapshot for October 6–12, 2026, South Okanagan district, all minor areas and all property types.
THE FEEL OF THE WEEK
A selective market rewards preparation
Activity felt slightly quieter overall, with pockets of movement and some improving confidence. Cooler weather and mid-October timing appear to be slowing the pace. Buyers who need to move before winter may feel more urgency, while others are taking more time. Some owners are already discussing spring listings, which suggests future supply is being planned even as the current market cools.
The data fit that selective tone. Compared with the seven-day report ending October 5, new listings declined from 77 to 70, price changes from 47 to 33, and changed-to-sold records from 34 to 26. Those are all-property comparisons from the same Xposure Hotsheet scope.
Off-market records fell from 105 to 34. That 71-record change followed the prior week’s month-end expiry cycle; it should not be interpreted as a 71-listing increase in active inventory. Listings can leave the market through cancellation or expiry, and a separate current active-residential inventory search was not validated for this report.
NEW CHOICE
Buyers saw 58 new residential-home listings
The Hotsheet recorded 70 new listings across all property types. Residential homes accounted for 58, with a median new asking price of $594,450. The remaining 12 new records were other property types: industrial, services, mixed use, agriculture, commercial lot, residential acreage, five-to-twelve-unit property, farm or ranch with buildings, and specialty property.
That distinction matters. A low lease rate on a commercial record or the asking price for land should not influence the median for homes. The $594,450 figure describes the midpoint of the 58 new residential-home asking prices, not a regional home value, sale-price forecast or affordability threshold.
For buyers, the useful action is to refresh the shortlist rather than assume 70 new choices apply to the kind of home you want. Filter by community, property type, ownership, condition and budget, then compare the best new options with listings that have been available longer.
PRICE POSITION
All 29 residential price changes were reductions
There were 33 price changes across all property types. The residential-home subset contained 29, and all 29 were reductions. The other four changes belonged to property types outside the residential-home subset, so the correct statement is not that all 33 market-wide changes were reductions.
The median residential reduction was approximately $20,000, or 3.90%. A median describes the middle reduction in this week’s group; it does not prescribe the adjustment for any one home.
Buyers should treat a reduction as a new conversation, not automatic proof of a bargain. Compare the revised price with recent similar sales, current competition and the property’s condition. Sellers should treat repeated showings without useful follow-up—or little showing activity at all—as information. The answer may involve price, but presentation, access, condition and the competing set also deserve review.
REPORTED SALES
Most residential sales in the snapshot were below $800,000
Xposure recorded 26 properties being reported or moved into sold status during October 6–12. Residential homes accounted for 24; the remaining two records were one industrial property and one residential acreage, both excluded from the residential pricing calculations.
Within the 24 residential records, the median sale price was $587,500, the median market time was 43 days, and the group achieved an aggregate 96.3% of current asking prices. Twenty-one of the 24 residential sales—87.5%—were below $800,000.
- Under $400,000: 4 residential sales
- $400,000 to $599,999: 9
- $600,000 to $799,999: 8
- $800,000 to $999,999: 1
- $1,000,000 and above: 2
This is a small weekly group, not a prediction for the next home. Still, it shows where reported movement was concentrated: the sub-$800,000 range accounted for 21 of the 24 residential records.
STATUS TIMING
“Changed to sold” does not mean every deal was written this week
The Hotsheet measures records reported or moved into sold status during the seven-day period. Of all 26 records, 14 show a contractual sold date inside October 6–12, 11 show an earlier sold date, and one shows a later sold date.
That is why this update uses “changed to sold” rather than saying 26 agreements were written during the week. MLS reporting and status timing can differ from the date buyers and sellers reached an agreement.
The area totals for all 26 records were Penticton 11, Summerland 6, Osoyoos/Rock Creek 4, Oliver 3, Keremeos/Cawston 1, and Kaleden/Okanagan Falls 1. Those area figures include the two non-residential records. The residential subset was Penticton 11, Summerland 4, Osoyoos/Rock Creek 4, Oliver 3, Keremeos/Cawston 1, and Kaleden/Okanagan Falls 1.
LISTINGS LEAVING THE MARKET
Thirty-four properties came off market
Across all property types, 34 records came off market: 21 were cancelled and 13 expired. Residential homes accounted for 27 of those records—18 cancelled and nine expired—leaving seven off-market records in other property types.
An expired or cancelled listing does not reveal the owner’s reason and does not prove that price was the only issue. Timing, plans, access, property condition, marketing, documentation or a decision to wait can all matter. Sellers considering a relaunch should review what buyers actually saw, how the property compared at the time, and what has changed since it left the market.
WHAT TO DO NOW
Turn the weekly numbers into a property decision
- Define the exact segment. Community, property type, ownership, size, condition and price range matter more than a broad label.
- Separate asking from selling. The $594,450 new-listing median and $587,500 sold median describe different residential groups.
- Use reductions as evidence, not instructions. A $20,000 median reduction does not mean every seller should make the same change.
- Check current competition. Weekly Hotsheet activity is useful context, but the active choices buyers can see today should guide the next step.
RICO’S TAKEAWAY
More room to think, but good homes still need a plan
This week did not deliver a dramatic market turn. It delivered a practical signal: buyers had fresh choice, sellers were still adjusting, and reported residential sales were concentrated below $800,000.
If you are buying, preparation gives you the freedom to move when the right home and price align. If you are selling, early feedback is valuable only if you use it. The next useful evidence will be whether changed-to-sold activity strengthens, whether residential reductions remain widespread, and whether new supply continues to ease deeper into fall.
Ask Rico for a property-specific buyer or seller comparison
General real-estate information only. This weekly snapshot is not a valuation, appraisal, forecast, legal, tax, mortgage or investment recommendation. Listing status and availability can change. Use current property records, financing guidance and appropriate professional advice for your circumstances.
Sources and method
- Association of Interior REALTORS® — authenticated Xposure Hotsheet. South Okanagan district 7, all minor areas and all property types, seven history days, October 6–12, 2026. Snapshot frozen October 12, 2026 at 10:15 a.m. PDT. Every non-zero result set was opened and reconciled: 70 new listings, 33 price changes, 26 changed-to-sold records and 34 off-market records. Conditional Sales and Other Changes were zero.
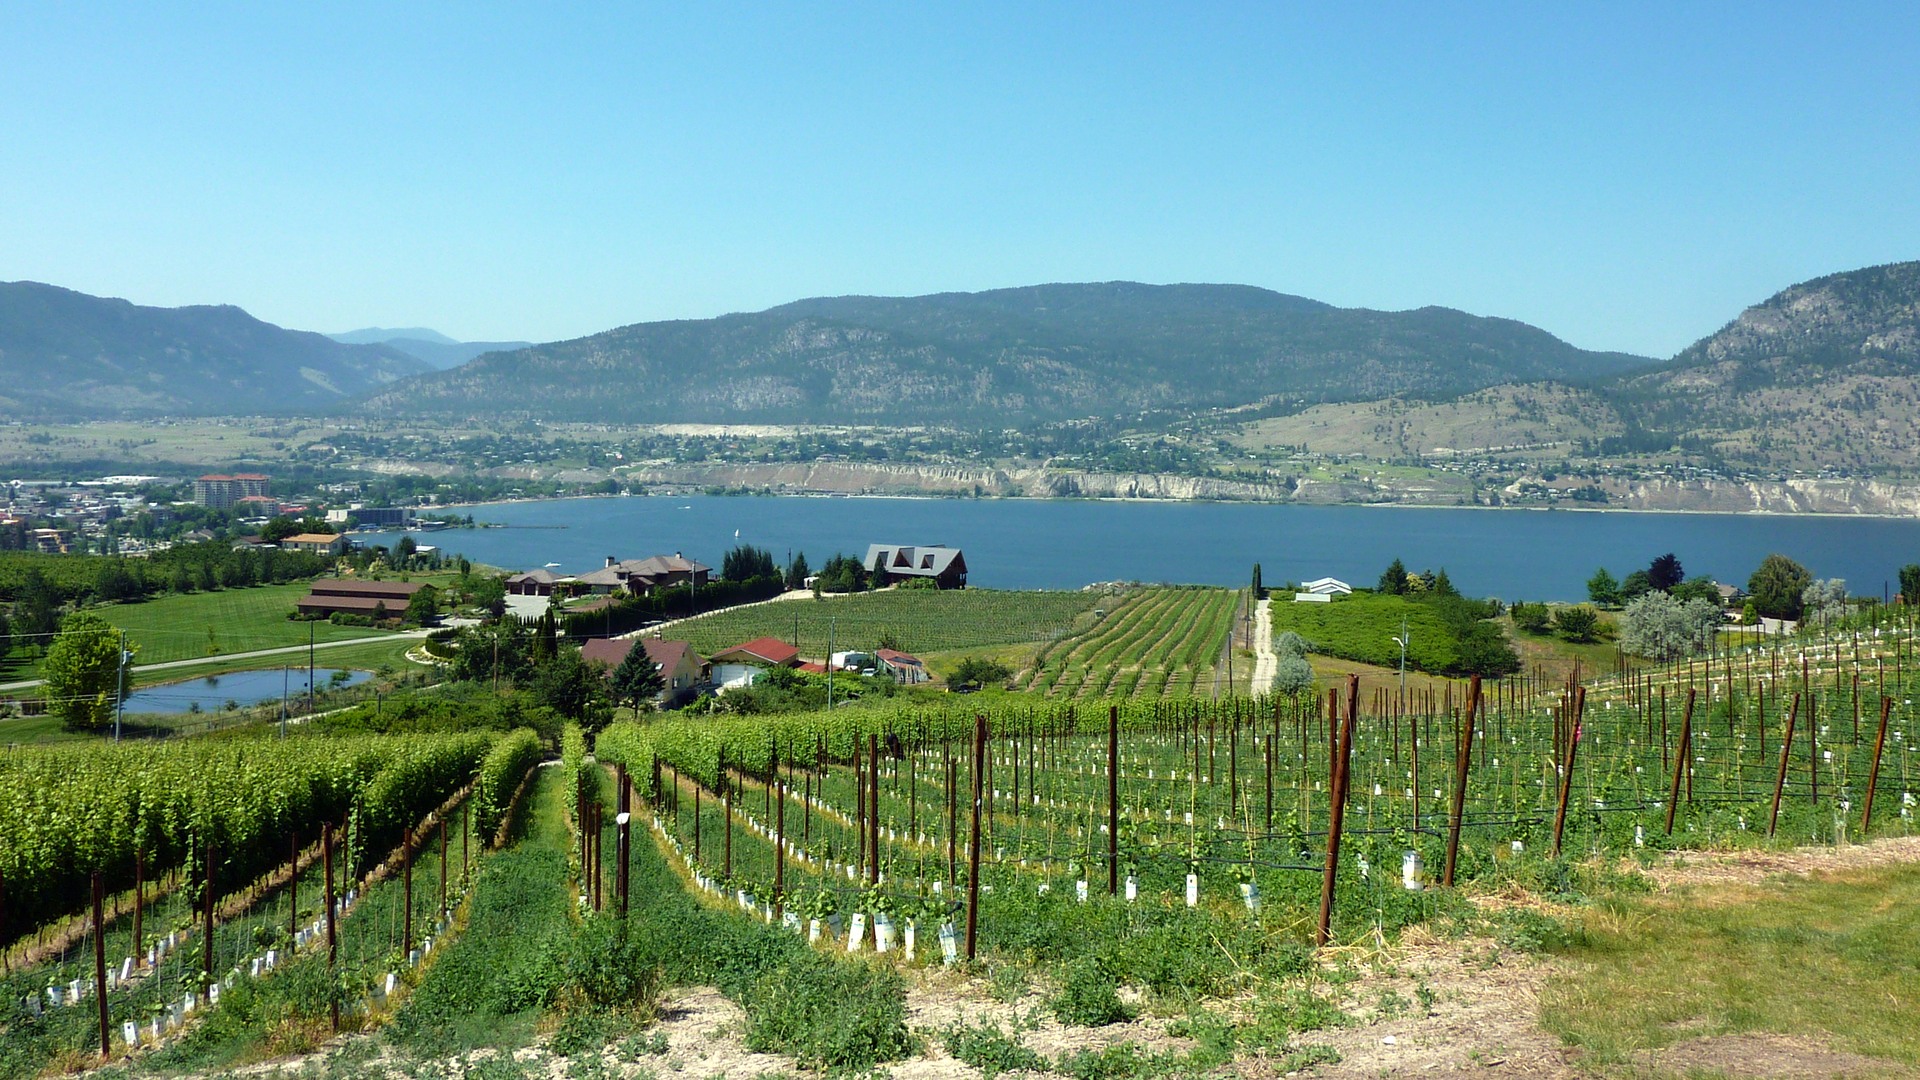
- Wikimedia Commons — Okanagan Lake from the Naramata Bench, photograph by Becks, July 11, 2012, licensed CC BY 2.0.

Image credit: Becks via Wikimedia Commons, CC BY 2.0. Authentic view from the Naramata Bench toward Okanagan Lake; representative regional context, not a listing or depiction of October 2026 market conditions. Centre-cropped and resized to 1,920 × 1,080; no synthetic elements added.
Turn the information into your next step
Choose the path that matches the decision you are making now.
Planning a Penticton move? Explore Rico’s Penticton real estate guidance and current listings.