
The current Okanagan Similkameen Homes search contains 1,254 publicly displayable DDF® records across eight communities. Of those records, 430 have asking prices below $500,000 and another 308 ask from $500,000 through $749,999. Together, 738 records—or 58.9% of the current search—ask under $750,000.[1]
That does not mean nearly six in ten properties are affordable to every household. An asking price is not a completed sale price, an appraisal, a mortgage approval or the total cost of ownership. The records also span different communities, property types and forms of ownership. A lower asking price can come with strata fees, lease payments, renovation needs, age or use restrictions, insurance questions, smaller living space or a location that does not fit the buyer.
The useful Monday question is therefore not simply, “How many listings are there?” It is, “How much of the current selection falls inside my workable price range, and what trade-offs sit behind that number?”
Meaningful selection sits below $750,000, but asking price is only the first filter.
CURRENT INVENTORY
The current asking-price ladder
Every record in the September 28 snapshot had a numeric asking price. The distribution was:[1]
| Asking-price band | Current DDF® records | Share of current search |
|---|---|---|
| Under $500,000 | 430 | 34.3% |
| $500,000–$749,999 | 308 | 24.6% |
| $750,000–$999,999 | 210 | 16.7% |
| $1,000,000 and above | 306 | 24.4% |
| Total | 1,254 | 100.0% |
The shape matters more than one regional average. The largest individual band is below $500,000, yet almost one quarter of the search is at $1 million or more. Between those ends, 518 records ask from $500,000 through $999,999.[1] Buyers browsing only the total can miss how quickly the pool changes when a maximum price is applied.
These are listing counts, not households, transactions or unique buildings. A development can contribute several active units. One property can also change price without entering or leaving the feed. The snapshot answers a narrow question: what asking prices were attached to the current records when the search was captured?
The band edges are editorial cutoffs chosen to make the search understandable. They are not financing thresholds. A home at $749,900 and one at $750,000 are practically close in price even though they appear in different rows. Buyers should search with enough flexibility to catch relevant properties, then apply their actual approval, down-payment, closing-cost and monthly-payment limits.
OWNERSHIP AND COST
Price is only the first filter
The ownership field in the same snapshot helps explain why price alone can mislead. It identifies 727 freehold records, 362 condo/strata records and 118 leasehold records; the field was not populated on 47 records.[1]
Those categories do not establish quality or suitability. They signal different questions. A freehold buyer may need to budget for direct maintenance, septic, well, acreage, access or older building systems where applicable. A strata buyer must review fees, bylaws, insurance, contingency funding, depreciation reporting, minutes and potential special levies. A leasehold buyer should understand the lease term, payment structure, assignment rules, financing availability and what happens at renewal or expiry.
Property form changes the picture again. The live records include houses, apartments, row or townhouses, manufactured homes, duplexes and other structures.[1] A $450,000 apartment, a $450,000 manufactured home and a $450,000 rural house can have very different monthly costs, inspection priorities and resale markets.
This is why a “homes under $500,000” search should never end at the list price. Add recurring fees, estimated maintenance, utilities, insurance, property tax, lease costs if any, and the likely cost of near-term work. Then compare the resulting monthly and cash requirements with the buyer’s lender-approved plan.
LOCAL LENS
Choice remains concentrated by community
The eight-community snapshot includes 410 records in Penticton, 318 in Osoyoos, 170 in Oliver and 150 in Summerland. Princeton has 79, Keremeos 66, Okanagan Falls 56 and Hedley five.[1]
Those counts should not be ranked as better or worse markets. They show where the current owned-site selection is concentrated. A buyer open to several communities may see a broad regional pool, while someone fixed on Hedley, Okanagan Falls or a narrow part of Keremeos may have few properties to compare.
Community and price interact. A household may find that its budget reaches a strata apartment in one location, a manufactured home in another, or a detached property farther from a preferred service centre. The decision is not only about obtaining more square footage. Travel time, medical access, schools, winter conditions, transit, shopping, utilities, internet, recreation and support networks can outweigh a price difference.
Smaller-community and rural properties can also require earlier due diligence. Water source, septic, road access, zoning, outbuildings, insurance, wildfire or flood information, agricultural influence and comparable-sales depth may all matter depending on the property. These are not automatic defects. They are facts to verify before the apparent value of a lower asking price is accepted.
The right sequence is lifestyle first, then property type and ownership, then price and condition. Reversing that order can produce a long list of inexpensive properties that do not solve the buyer’s actual housing need.
LATEST COMPLETE DATA
Keep current listings separate from completed sales
The latest complete Association report covers August 2026, not the current September 28 search. Across all South Okanagan property types, it recorded 129 sales, 277 new listings and 1,880 active listings at month-end.[2] Its stated scope includes residential, farms, multifamily, land and commercial property.
The residential-only tables recorded 116 August sales, 221 new residential listings and 1,328 residential listings in inventory.[2] Within selected residential categories, the report recorded 55 sales of single-family homes excluding lakefront and acreages, 20 apartment sales and eight townhouse sales.[2]
None of those Association totals should be directly divided into the 1,254-record DDF® snapshot. The dates are different, the geographic and property scopes are different, and the owned search is a consumer-facing collection across eight approved communities. The Association report is a completed monthly statistical record for its South Okanagan area.
The two sources answer complementary questions. The September 28 snapshot shows what a visitor can browse now. The August report shows completed activity under the Association’s definitions. Current listings are useful for understanding today’s competition and alternatives; completed sales are useful for studying what buyers and sellers previously agreed to. Neither source, by itself, predicts October.
VALUE DISCIPLINE
Do not turn an asking-price count into a value claim
A listing price is an invitation to the market. It can be supported by comparable evidence, positioned above likely value, set to encourage competition or changed after the listing launches. The final sale price may be higher, lower or equal, and some listings will not sell during their current exposure.
The current distribution therefore does not prove that values fell, that buyers have gained a fixed amount of negotiating leverage, or that a seller must price inside the largest band. It also does not show how long each property has been listed, whether it has changed price, whether it carries an accepted offer or whether its condition differs from nearby alternatives.
For a buyer, value work begins with the closest relevant completed sales, adjusted cautiously for timing, location, property type, size, condition, ownership and features. For a seller, the active competition matters because buyers can see it today, but the asking prices of unsold homes are not completed evidence.
For a homeowner, regional price bands do not create or erase equity. Equity is the current property value minus debt secured against the property. Current value needs local comparable sales, current competition and property-specific evidence. A lender then applies its own appraisal, qualification and lending criteria to refinancing or home-equity borrowing.
FOR BUYERS, SELLERS AND OWNERS
What this means for you
ACTION PLAN
A practical plan for this week
- Set a monthly ceiling. Ask the lender or mortgage broker to translate the approval into a purchase plan that includes property tax, heating, strata or lease costs, insurance and realistic maintenance.
- Choose acceptable ownership forms. Decide whether freehold, strata, leasehold or manufactured-home arrangements fit the financing and long-term plan before treating every lower-priced record as comparable.
- Shortlist communities around daily life. Test travel, services, family needs and winter access. Do not trade away a necessary location simply because another community has more listings.
- Open the actual records. Review the property details, not only the search card. Confirm living area, lot, fees, title or tenure, parking, storage, age, condition and restrictions.
- Separate active and sold evidence. Use current listings to understand choice and competition. Use relevant completed sales for value analysis. Keep both in the same property type and micro-market wherever possible.
- Budget for investigation. Inspection, legal review, appraisal, insurance, strata-document review, water or septic work and other property-specific checks can affect both timing and cash needs.
- Recheck before acting. DDF® inventory changes as records are added, revised and removed. Refresh the search and the property status before writing an offer or changing a listing strategy.
RICO’S VIEW
Rico’s view: narrow the market before judging it
The headline number is broad enough to sound encouraging: 1,254 current records and 738 asking under $750,000.[1] But nobody buys a regional count. A buyer purchases one property with one ownership structure, one condition profile and one monthly cost.
That is why the most useful market update is a narrowing exercise. A Penticton condo buyer should not let million-dollar acreages shape the decision. A Princeton detached-home seller should not compare the property with every low-priced apartment in the region. An Osoyoos buyer considering leasehold and freehold choices needs to understand the ownership difference before deciding which price is more attractive.
The current data support a measured conclusion. There is meaningful selection below $750,000, but the selection is not interchangeable and the asking prices are not completed values. August remains the latest complete sales month, and its 129 all-property sales belong to a different scope from today’s 1,254-record DDF® search.[1][2]
Use the guided Matchmaker to organize community, property type, budget and timing. If you are planning a sale, visit Sell, or contact Rico for a property-specific comparison.
This article provides general real-estate information, not a valuation, forecast, mortgage, insurance, legal, tax, appraisal or investment recommendation. Listing availability and asking prices can change. Confirm current property facts, financing and professional-advice requirements for your circumstances.
Sources
- Okanagan Similkameen Homes — current DDF® inventory snapshot, captured September 28, 2026
- Association of Interior REALTORS® — South Okanagan Monthly Statistics, August 2026
- Wikimedia Commons — Princeton, British Columbia photograph by Cjstepney

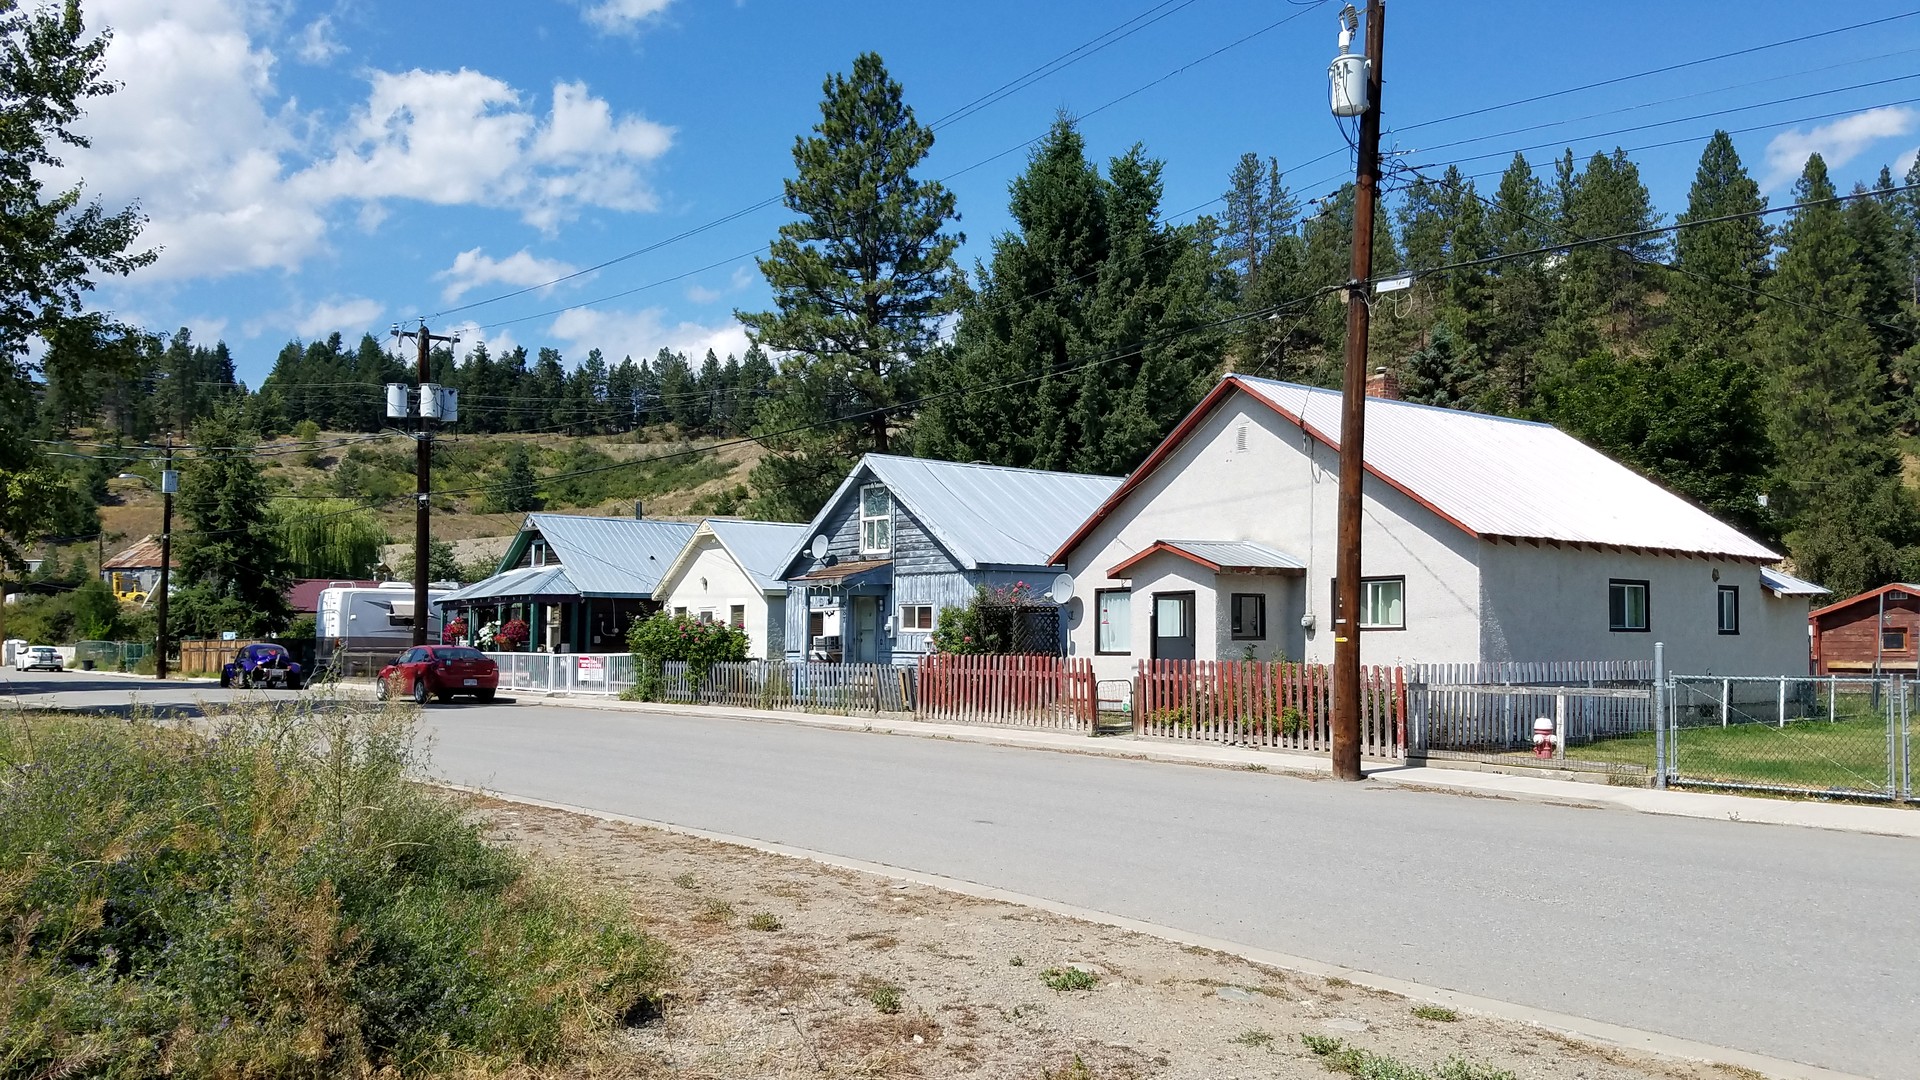
Image credit: Cjstepney, Wikimedia Commons, CC BY-SA 4.0. Representative residential street in Princeton; not a listing or depiction of September 2026 inventory or market conditions. Cropped, resized and lightly contrast-adjusted; derivative remains CC BY-SA 4.0.
Turn the information into your next step
Choose the path that matches the decision you are making now.
Planning a Penticton move? Explore Rico’s Penticton real estate guidance and current listings.